|
Reflectance in Minerals |
|
|
Reflectance in Minerals |
|
See Also: Color, Pleochroism, Bireflectance, and Anisotrophism. Reflected light microscopy is used to examine opaque minerals (and other materials, e.g.. ceramics) to determine the paragenetic relationships between different mineral phases and their identification. Often, the same specimen which is viewed using the light microscope can be analyzed using advanced x-ray and ion microprobe techniques.
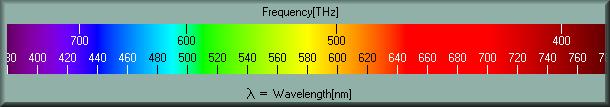
The process to measure reflected light is very simple. The sample (polished thin section, epoxy grain mount, or polished section) is placed in the appropriate reflected light microscope. The reflectivity is measured by observing the incident and reflected light at different wavelengths. The reflective index is the percentage of light that bounces off the solid surface and is not absorbed. The apparatus is calibrated using reflective standards such as silicon carbide (SiC) or other materials with a known response. Method to Display RGB ValuesReflectance measurements for opaque minerals consists of a table of wavelength values versus % reflectivity at that wavelength. The measurements are generally made in air but oil is sometimes used for high magnifications. In addition, reflectance values for pleochroic materials are listed as R1 and R2 values. These values are calibrated to known standards and represent the "standardized intensity" of that mineral. To regenerate the original macroscopic color from reflectance measurements, the red, green and blue (RGB) values for each mineral are added from the spectral data, normalized, and recalculated as ∑ R (λ).
RGB measurements are based on the the component colors for pure red (255,0,0), green (0,255,0), and blue (0,0,255). In this system, black is (0,0,0) and white is (255,255,255). There are 16,581,375 colors based on the RGB nomenclature. Since RGB color is based on human perception, there is no "correct" value of RGB to wavelength. Because the color response of computer monitors is also a variable, the colors represented from these examples is only approximate. Calculated Relative Intensity ColorsThe calculated relative intensity colors are approximated by taking the reflection measurements of the "standardized intensity" values and multiplying by a percentage from 0% to 1,000%. These values are then normalized, and recalculated as ∑ R (λ) as a function of relative intensities based on the 0 to 10 values (0 to 1,000%). The range of colors are selected to span all values of RGB from (0,0,0) to (255,255,255). The representative ranges for each species are selected by picking those ranges to display a reasonable color spectrum. The following examples represent a selection of colors calculated for common opaque minerals:
Notice the extreme pleochroism in graphite.
In all cases, the color represented in these tables approximates the pleochroic color (R1 & R2) or color (R) viewed in a polished section of that mineral under plane polarized light. The relative intensities in the tables show how much illumination is required to see the colors from each species. Click here to view a table of all the opaque-mineral reflected-light calculated colors. Other References to Reflectivity and "Color"An Atlas of Opaque and Ore Minerals and their Associations from the SME Reflected-light Microscopy from the University of Utah. Data from the "Visible Light Spectrum" program from efg's Computer Lab was used to obtain the spectral colors used in the calculation of the macroscopic color based on reflectance measurments. Dan Bruton's COLOR SCIENCE web page. Search the Mineralogy DatabaseExample Subject Searches
Search the Web |